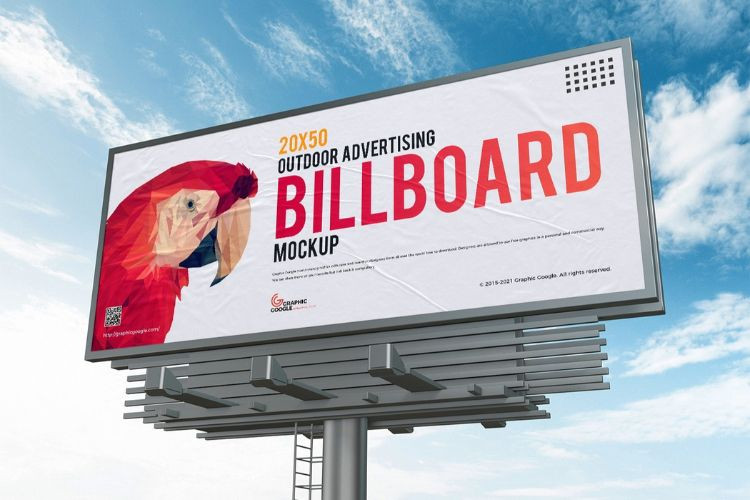
How to Measure OOH Advertising: A Data-Driven Guide to Proving ROI
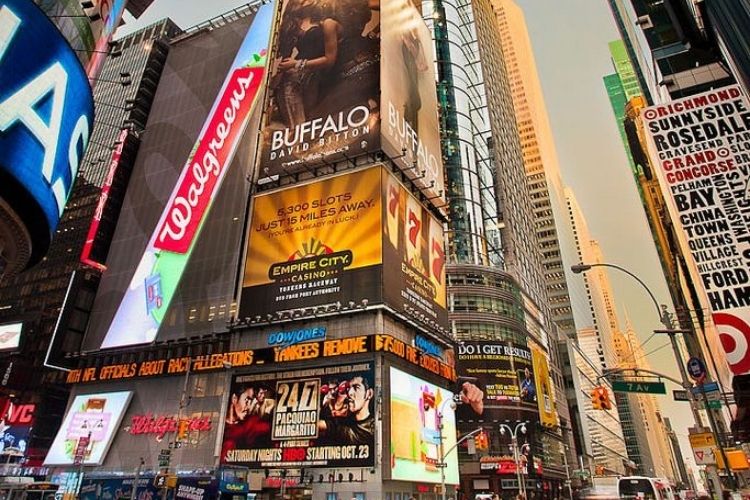
Out-of-home (OOH) advertising has long been a cornerstone of brand-building, a medium of scale and spectacle. From the towering, neon-lit billboards of Times Square to the sleek, targeted digital screens in a modern urban elevator, OOH occupies the spaces in between our daily journeys. For decades, its value was often relegated to the realm of the intangible—a "spray and pray" model where massive reach was assumed, but real impact was a matter of faith. Marketers would speak of "opportunities to see" and rely on crude traffic counts, all while their digital counterparts enjoyed a world of precise clicks, impressions, and conversion tracking.
Ready to See Your OOH Impact? Book a Free Consultation with Firstboard
However, a profound revolution is underway. The same digital transformation that disrupted media is now empowering OOH, transforming it from a blunt awareness instrument into a sharp, measurable, and dynamic performance channel. The old adage, "Half my advertising is wasted, I just don't know which half," no longer needs to apply to the physical world. Today, measuring the impact of your OOH campaign is not only possible—it’s essential for any marketer looking to justify spend, optimize strategy, and drive tangible business outcomes.
But how do we bridge the gap between the physical impression on a highway and the digital conversion on a smartphone? How do we quantify the resonance of a creative in a train station? This guide moves beyond theory to provide a practical, comprehensive framework for measuring the effectiveness of your OOH advertising, turning real-world visibility into actionable data and smarter marketing decisions.
Why Measuring OOH Campaigns Matters
At its core, OOH advertising aims to achieve fundamental marketing objectives: building dominant brand awareness, driving physical foot traffic or digital engagement, and ultimately influencing purchasing decisions. Yet, in an era of hyper-accountability, "aiming" is not enough. Knowing what's working and what’s not with a reasonable degree of certainty is what separates modern, effective campaigns from expensive gambles.
A rigorous measurement strategy allows you to:
-
Justify and Secure Advertising Spend: CFOs and budget committees demand data-driven returns. When you can demonstrate that a specific billboard campaign led to a 15% lift in store visits in a geo-fenced area, or that a transit ad generated 5,000 unique website visits, you transform OOH from a cost center into a proven growth engine.
-
Optimize Placements and Creative in Near Real-Time: Measurement isn't just for post-campaign post-mortems. With live data feeds, you can identify underperforming locations and shift budgets dynamically. You can A/B test different creative messages on digital OOH networks, doubling down on the visuals and copy that drive the highest response rates.
-
Compare Performance Across Marketing Channels: How does the cost-per-acquisition of an OOH campaign compare to a social media or search campaign? By attributing outcomes to OOH, you can make apples-to-apples comparisons, enabling smarter, holistic budget allocation across your entire marketing mix.
-
Maximize Return on Investment (ROI): This is the ultimate goal. By understanding which formats, locations, and messages deliver the best results, you can continually refine your strategy, ensuring every dollar spent is working as hard as possible to achieve your business objectives.
Failing to measure impact doesn't just represent a missed opportunity; it actively risks wasting significant resources on placements that fail to connect with your audience or drive desired actions. Let’s break down the practical methods to capture and interpret this crucial data.
1. Set Clear Objectives
Before a single ad is printed or a digital slot is booked, you must define what success looks like. A vague goal like "increase awareness" is immeasurable. A precise objective is. Your campaign's goals will directly dictate the metrics you track and the tools you use.
Common and Measurable OOH Objectives Include:
-
Brand Awareness & Recall: The classic OOH goal. Success is measured by a shift in consumer perception and unaided recall of your brand or campaign. Measurement Method: Pre- and post-campaign brand lift surveys.
-
Website Traffic & Engagement: Using OOH as a top-funnel driver to a digital property. The goal is a quantifiable increase in visits, time on site, or page views. Measurement Method: Unique URLs, QR codes, and UTM parameters tracked in Google Analytics.
-
Mobile App Downloads: A critical objective for tech companies and services. The OOH creative must facilitate a seamless journey to the App Store or Google Play. Measurement Method: Promo codes, QR codes linking directly to the app store, or attributing downloads from specific geographic areas.
-
Lead Generation: Capturing potential customer information for follow-up. Measurement Method: Shortcodes (SMS), QR codes linked to gated content, or unique landing pages with form fills.
-
Foot Traffic and In-Store Visits: The lifeblood of retail, restaurant, and event marketing. The goal is to drive people from the street into a physical location. Measurement Method: Mobile location data analysis, promoted in-store offers, and point-of-sale (POS) data correlation.
-
Direct Response & Sales: While harder, it's possible to attribute direct sales to OOH, especially for e-commerce brands. Measurement Method: Exclusive promo codes, unique URLs with special offers, and call tracking numbers.
By establishing a clear, primary goal from the outset, you create a strategic foundation that informs every subsequent decision, from creative design to media buying.
2. Building Digital Bridges: Deploy Unique Tracking Mechanisms
The most straightforward way to attribute consumer action to your OOH campaign is to provide a trackable pathway. These mechanisms act as "digital bridges," connecting the anonymous physical audience to your measurable digital ecosystem.
-
Custom URLs and Landing Pages: Instead of directing people to your generic homepage, create a campaign-specific URL (e.g., yourbrand.com/nycsummer or get.offer/billboard45). This allows you to track all traffic to this page in Google Analytics as direct traffic originating from the OOH campaign. Enhance this with UTM parameters for even deeper granularity (e.g., tracking source, medium, and creative version).
-
QR Codes: Once considered a gimmick, QR codes have been resurrected by the pandemic and are now a standard, consumer-friendly tool. A simple scan can direct users to a specific landing page, a video, a coupon, or an app download. The analytics from the QR code provider will tell you how many times the code was scanned, when, and from what general location.
-
Promo Codes and Exclusive Offers: Featuring a campaign-specific promo code (e.g., "BILLBOARD15") on your creative is a powerful way to track direct conversions, both online and in-store. This provides crystal-clear evidence of the campaign's impact on sales.
-
Call Tracking Numbers: For businesses that rely on phone leads (e.g., legal services, home services), using a dedicated phone number on your OOH creative is a classic but effective method. Modern call tracking solutions can record calls, providing insights into call volume and quality, directly attributable to the ad.
When using these mechanisms, ensure the user journey is seamless. A QR code should lead to a mobile-optimized page. A promo code should offer a genuinely compelling discount. The goal is to reduce friction, making it easy for a captivated audience to take the next step.
3. The Power of Place: Leveraging Mobile Location Data
This is where OOH measurement transcends simple tracking and enters the realm of advanced analytics. Through partnerships with data aggregators like Cuebiq, PlaceIQ, and Foursquare, marketers can access vast pools of anonymized mobile device data. By creating a "geo-fence"—a virtual boundary around your OOH placement and your nearby points of interest (e.g., retail stores)—you can glean profound behavioral insights.
Here’s what this data can reveal:
-
Reach and Frequency: Estimate how many unique devices were exposed to your ad and how often.
-
Audience Insights: Understand the demographic and behavioral profile of the people who pass by your ad, even if they don't immediately scan a code.
-
Foot Traffic Attribution (Visit Lift): This is the gold standard for retail. The platform can analyze devices that were both exposed to the OOH ad and subsequently visited your store, comparing this to a control group that was not exposed. It can calculate a precise "visit lift" percentage, proving the ad's effectiveness in driving physical traffic.
-
Dwell Time: See if people are slowing down or stopping to engage with your ad, which is particularly useful for evaluating placements in high-foot-traffic but fast-moving areas like transit hubs.
For example, a coffee chain could place a digital billboard near a subway exit. Using location data, they could not only measure how many people who saw the ad then visited their shop within an hour but also compare the performance of a simple brand ad against a dynamic ad promoting a morning discount.
4. Capturing the Ripple Effect: Monitoring Digital Uplift
OOH doesn't exist in a vacuum. A compelling billboard or a clever bus wrap doesn't always provoke an immediate, trackable action. Instead, it plants a seed, often leading to a digital search hours later. This "online ripple effect" is a significant component of OOH's value.
Key indicators to monitor during your campaign flight include:
-
Branded Search Volume: A sudden and sustained spike in searches for your brand name, product, or campaign slogan on Google is a strong signal of increased awareness. Tools like Google Trends and Google Ads Keyword Planner are perfect for visualizing these surges on a geo-specific basis.
-
Direct Website Traffic: While custom URLs are ideal, you will often see an increase in general direct traffic to your website from the geographic regions where your campaign is active.
-
Social Media Mentions and Engagement: Is your campaign visually striking or conversation-starting? Use social listening tools (e.g., Brandwatch, Sprout Social) to track mentions, hashtag usage, and share-of-voice. A viral OOH campaign can generate millions of impressions online, far beyond its physical viewership.
By correlating the timing and geography of your OOH campaign with these digital uplifts, you can build a compelling case for its broader impact on the customer journey.
5. Probing Perception: Conducting Brand Lift Surveys
For campaigns where the primary goal is to shift public perception, opinion, or awareness, direct consumer feedback is indispensable. Brand lift studies are designed to measure this exact phenomenon.
You can conduct these surveys in several ways:
-
Pre- and Post-Campaign Digital Surveys: Using large, representative online panels, you survey users who were exposed to your ad (the "test group") and those who were not (the "control group"). The difference in their answers reveals the campaign's "lift" in metrics like ad recall, brand awareness, and purchase intent.
-
On-the-Street Interviews: For hyper-local campaigns, intercept surveys near the OOH placement can provide immediate, qualitative feedback. While less statistically projectable, they offer rich, contextual insights.
-
Partnerships with OOH Providers: Many digital OOH networks now have integrated technologies (like cameras with anonymous audience analytics) that can trigger short, on-screen surveys or companion mobile surveys to gauge immediate reaction.
This method is crucial for brand-building exercises where a direct, trackable action is a secondary or long-term goal.
6. The Scientific Method: Comparing Market Performance
For brands running large, multi-region campaigns, the test-and-control methodology provides a robust framework for measurement. This involves selecting two or more demographically similar markets.
-
Test Market(s): These cities or regions receive the full OOH campaign.
-
Control Market(s): These comparable areas receive no OOH advertising.
By comparing the performance data (sales, web traffic, app downloads, foot traffic) between these markets during the campaign period, you can isolate the incremental impact of your OOH efforts, controlling for other national marketing activities or broader economic trends. If sales rose by 8% in the test market but only 2% in the control market, you have strong evidence attributing that 6% lift to OOH.
With the right tools, every billboard becomes a data point — and every impression becomes an opportunity.

7. The Command Center: Utilizing OOH Attribution Platforms
The modern marketer doesn't need to stitch these data sources together manually. A new category of software-as-a-service (SaaS) platforms has emerged to serve as centralized command centers for OOH planning, buying, and measurement.
Platforms like AdQuick, Vistar Media, Placer.ai, and OneScreen.ai consolidate data from myriad sources:
-
Traditional Circulation Data: Updated models for traffic and pedestrian flow.
-
Mobile Location Data: Integrated directly for foot traffic attribution.
-
Programmatic Buying: Allowing for real-time optimization of digital OOH placements.
-
Third-Party Data Integrations: Layering in demographic, POI, and even weather data to understand performance drivers.
These platforms provide a holistic dashboard view of your campaign's performance, answering not just "how many people saw it?" but "who were they, what did they do next,
and what was the business outcome?"
The Future is Fused: Integrating OOH into the Omnichannel Journey
The final frontier of OOH measurement lies in its full integration with the wider marketing ecosystem. The future is Dynamic Creative Optimization (DCO), where digital OOH screens change their message based on real-time data feeds—like weather, traffic, sports scores, or even programmatic triggers from online behavior. Imagine a car brand serving an ad for its 4x4 vehicle on digital billboards only in neighborhoods where it's starting to snow, and then measuring the foot traffic lift to local dealerships.
Furthermore, the rise of retail media networks is creating a new, hyper-measurable OOH canvas within stores themselves, with screens at the point of sale that can be directly tied to purchase data.
Conclusion: From Static Spectacle to Dynamic Growth Engine
OOH advertising has shed its skin as a static, unmeasurable medium. It has enthusiastically embraced the data revolution, emerging more vital and accountable than ever before. The billboards of yesterday were monuments; the billboards of today are interactive, data-rich touchpoints in the consumer's journey.
With the strategies outlined above—clear goals, smart tracking links, powerful location data, digital correlation, perceptual surveys, market comparisons, and dedicated platforms—you possess the blueprint for transformation. You can now approach OOH not with a gambler's hope, but with a scientist's rigor.
We, as marketers, no longer need to guess. We can measure. We can attribute. We can optimize in flight. And most importantly, we can prove the undeniable value of making a mark in the real world, turning every billboard into a data point, every transit ad into a conversation starter, and every OOH impression into a dynamic, data-driven component of your growth engine. The tools are here. The time to use them is now.
Ready to Measure Your OOH Campaign Success?
If you're planning an OOH campaign and want to ensure every impression counts, we can help. From campaign strategy to analytics and attribution, our team is equipped to drive real results.
Contact us today for a free OOH impact assessment and start turning eyeballs into outcomes.
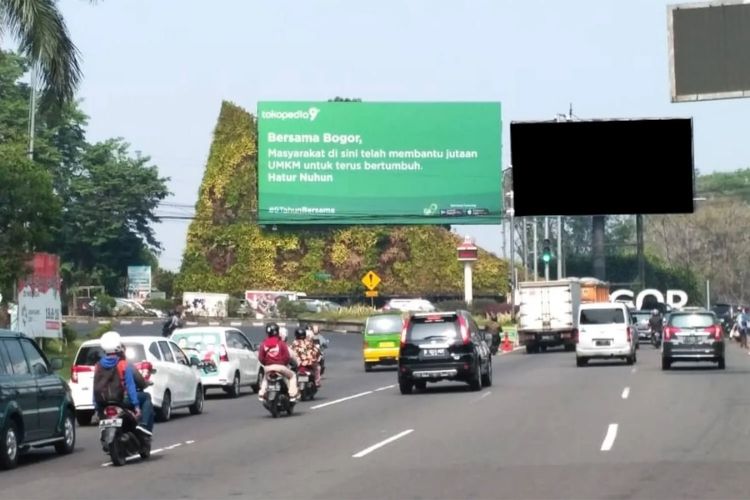
Picture: StickEarn, Warna Warni, Spesialis Huruf Timbul, Optima


